History of Cartography timelines
During the first session of his course on the history of cartography at the University of Gent, on 22 October 2011, Prof. Dr. Philippe De Maeyer gave a chronological overview of the evolution of cartography, from the earliest times till today. These more than 2500 years of steady evolution of techniques to measure and represent the earth and to determine positions on it, is hard to summarise in just a few pages.
However, Prof. De Maeyer provided four timelines that offer a comprehensive overview of the political situation, the most important scientists, cartographers and editors of those days.
 (JPG file, 2.3 MB)
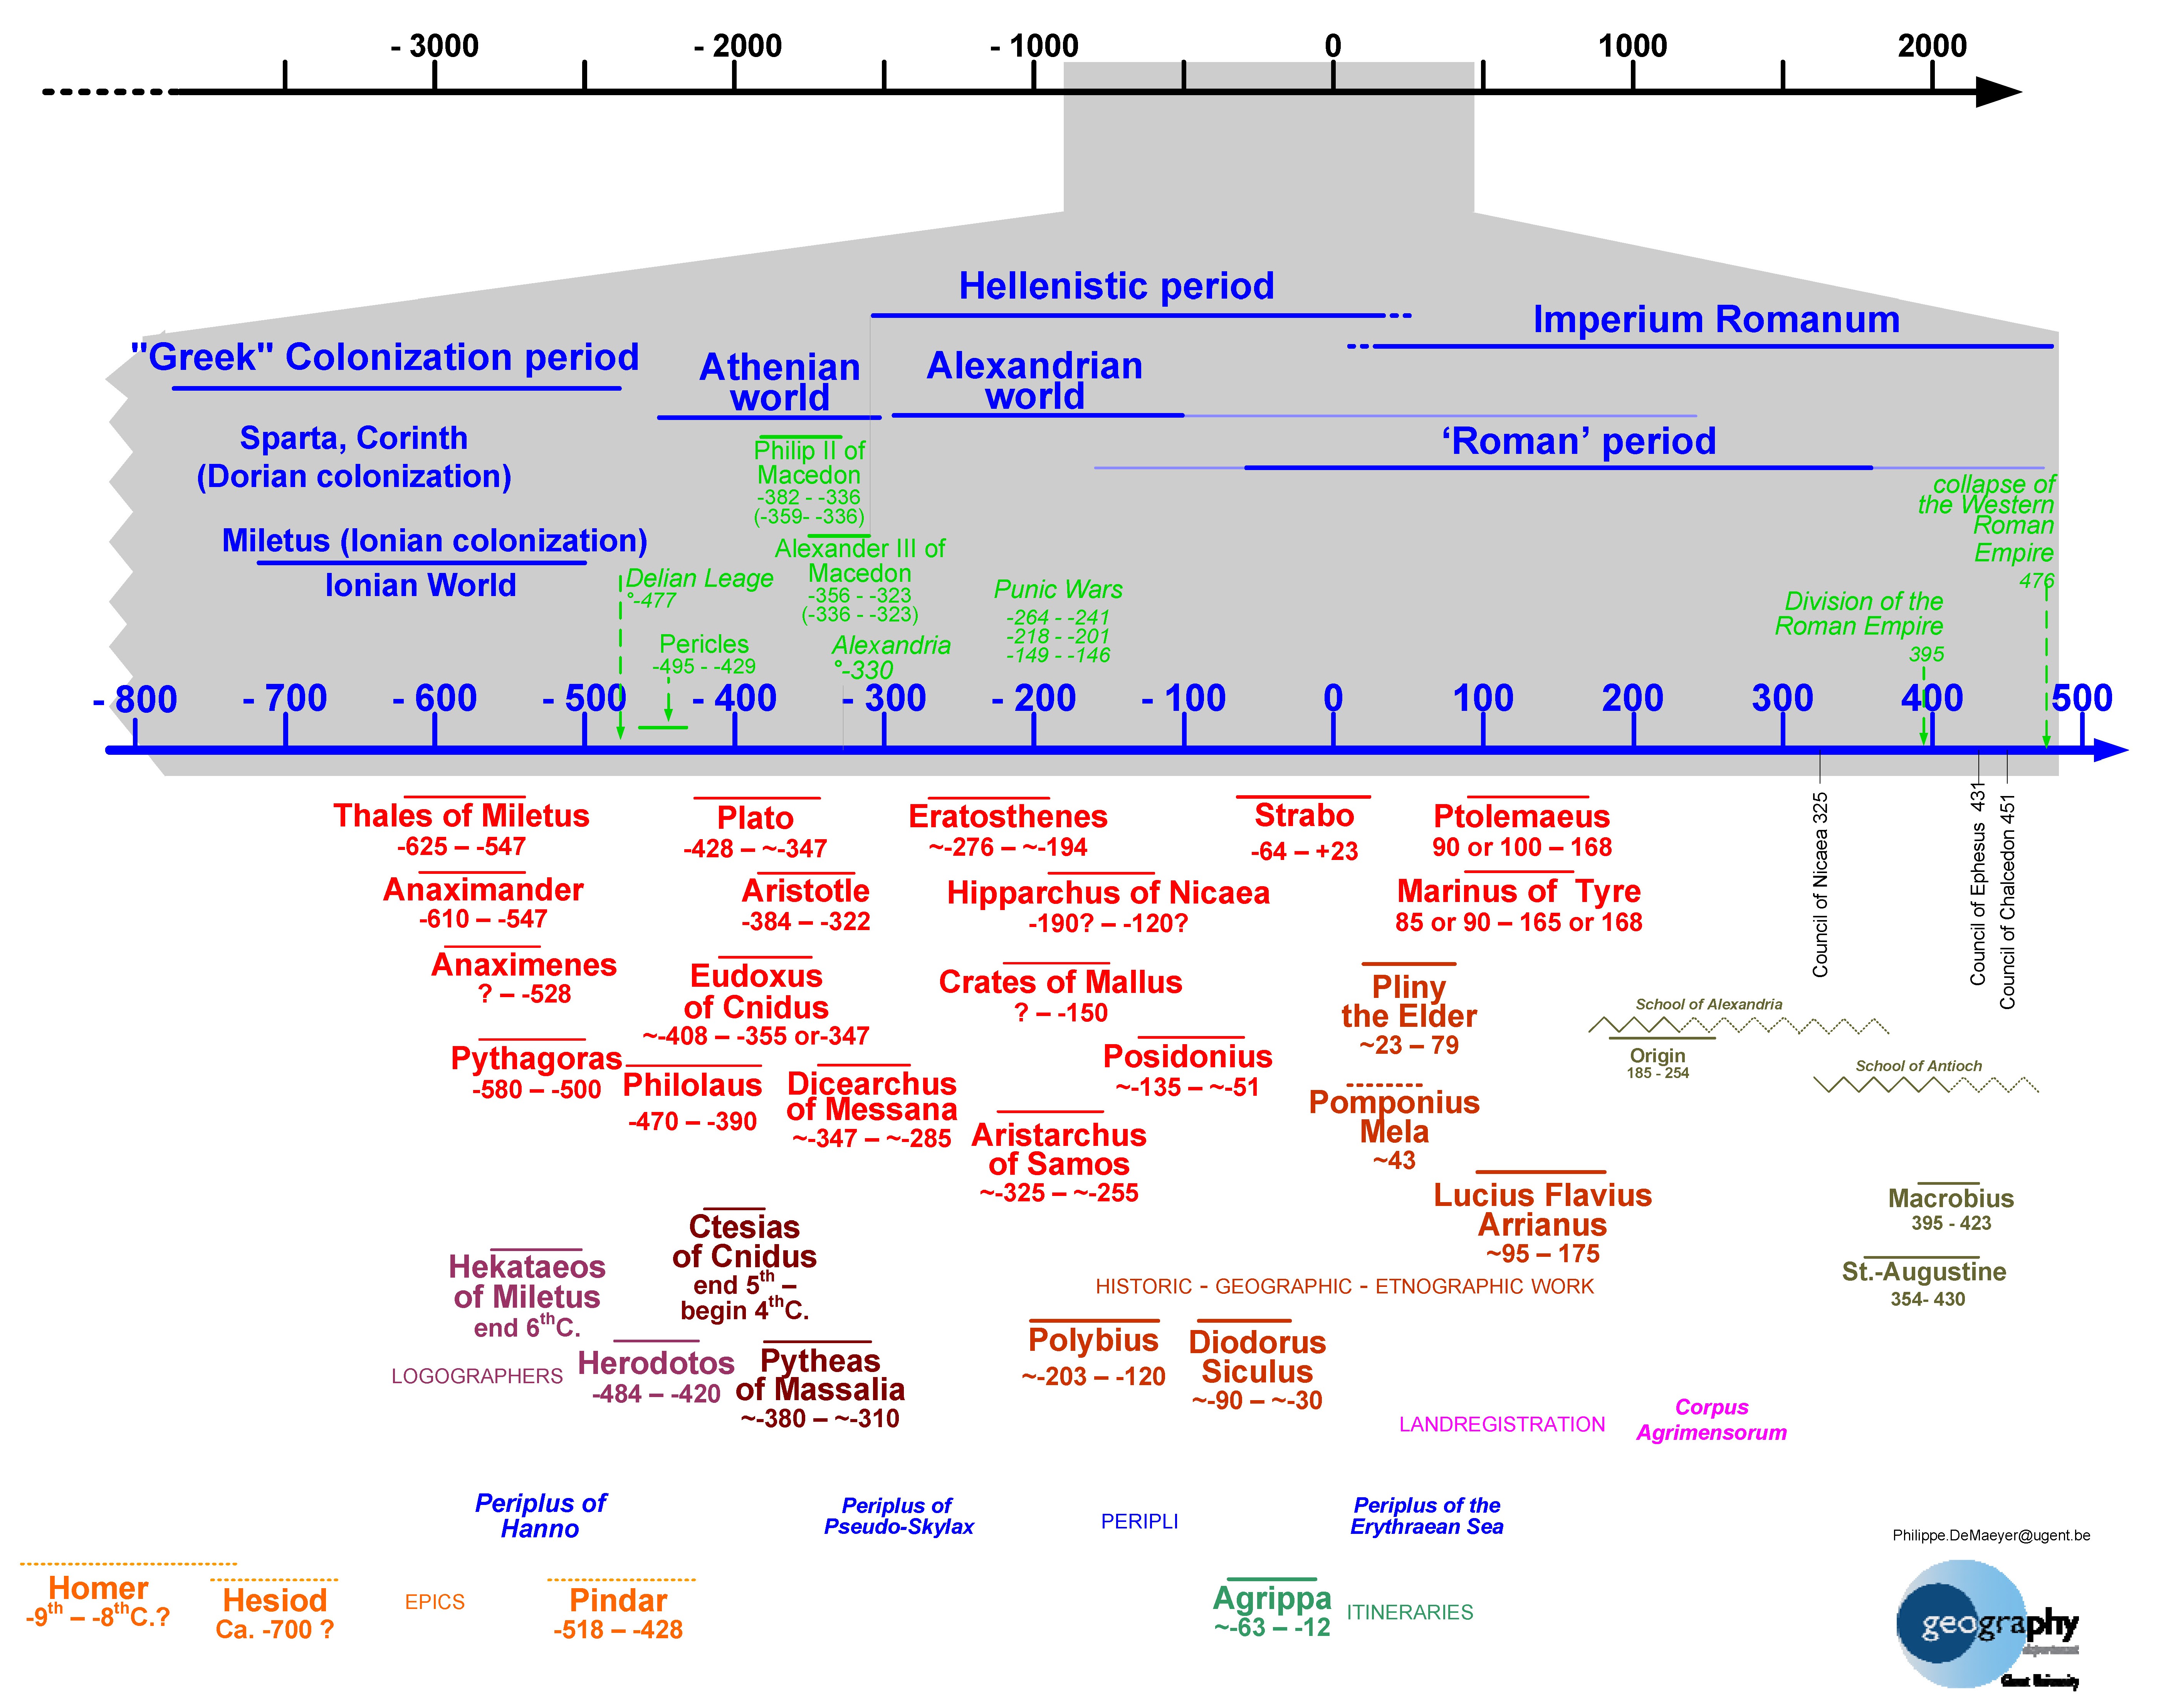
Comments on the 'Antiquity' timeline
Whereas Pythagoras and his followers apostle a geocentric system, with a spherical earth in the centre of all planets, it was Philolaos who proclaimed the earth and all the planets were revolving around a central fire. Copernicus would much later on explicitly use this thesis to build his revolutionary theory on it. Herodotos, noting down his travel experiences, would confirm the Pythagorean view that the earth was round and contained three continents: Europe, Africa and Asia. Eratosthenes was the first to estimate the circumference of the earth. Although there is controversy about the exact result of his calculations, it is clear he came very close to the actual cipher of 40 000 km. Others, like Posidonius, would also try this measurement, but due to their erroneous measuring would conclude the earth was much smaller. It is thought that this view would much later instigate Columbus to sail to India, believing it was only a short distance away.
Strabo would provide a synthesis of all his predecessors' works, which were in many cases lost.
Ptolemy's work Geographia would be lost in its original form, but the Islamic world would pass it on to the west some thousand years later, where it became paramount. In this work Ptolemy defines the coordinates of 8 000 geographical positions. It contained 26 maps and one overview map. But before there was this Ptolemaic revival in the West in the 15th century, a whole different way of looking at and depicting the world would emerge, the direct result of the religion that would dominate the West: Christianity.
 (JPG file, 3.6 MB)
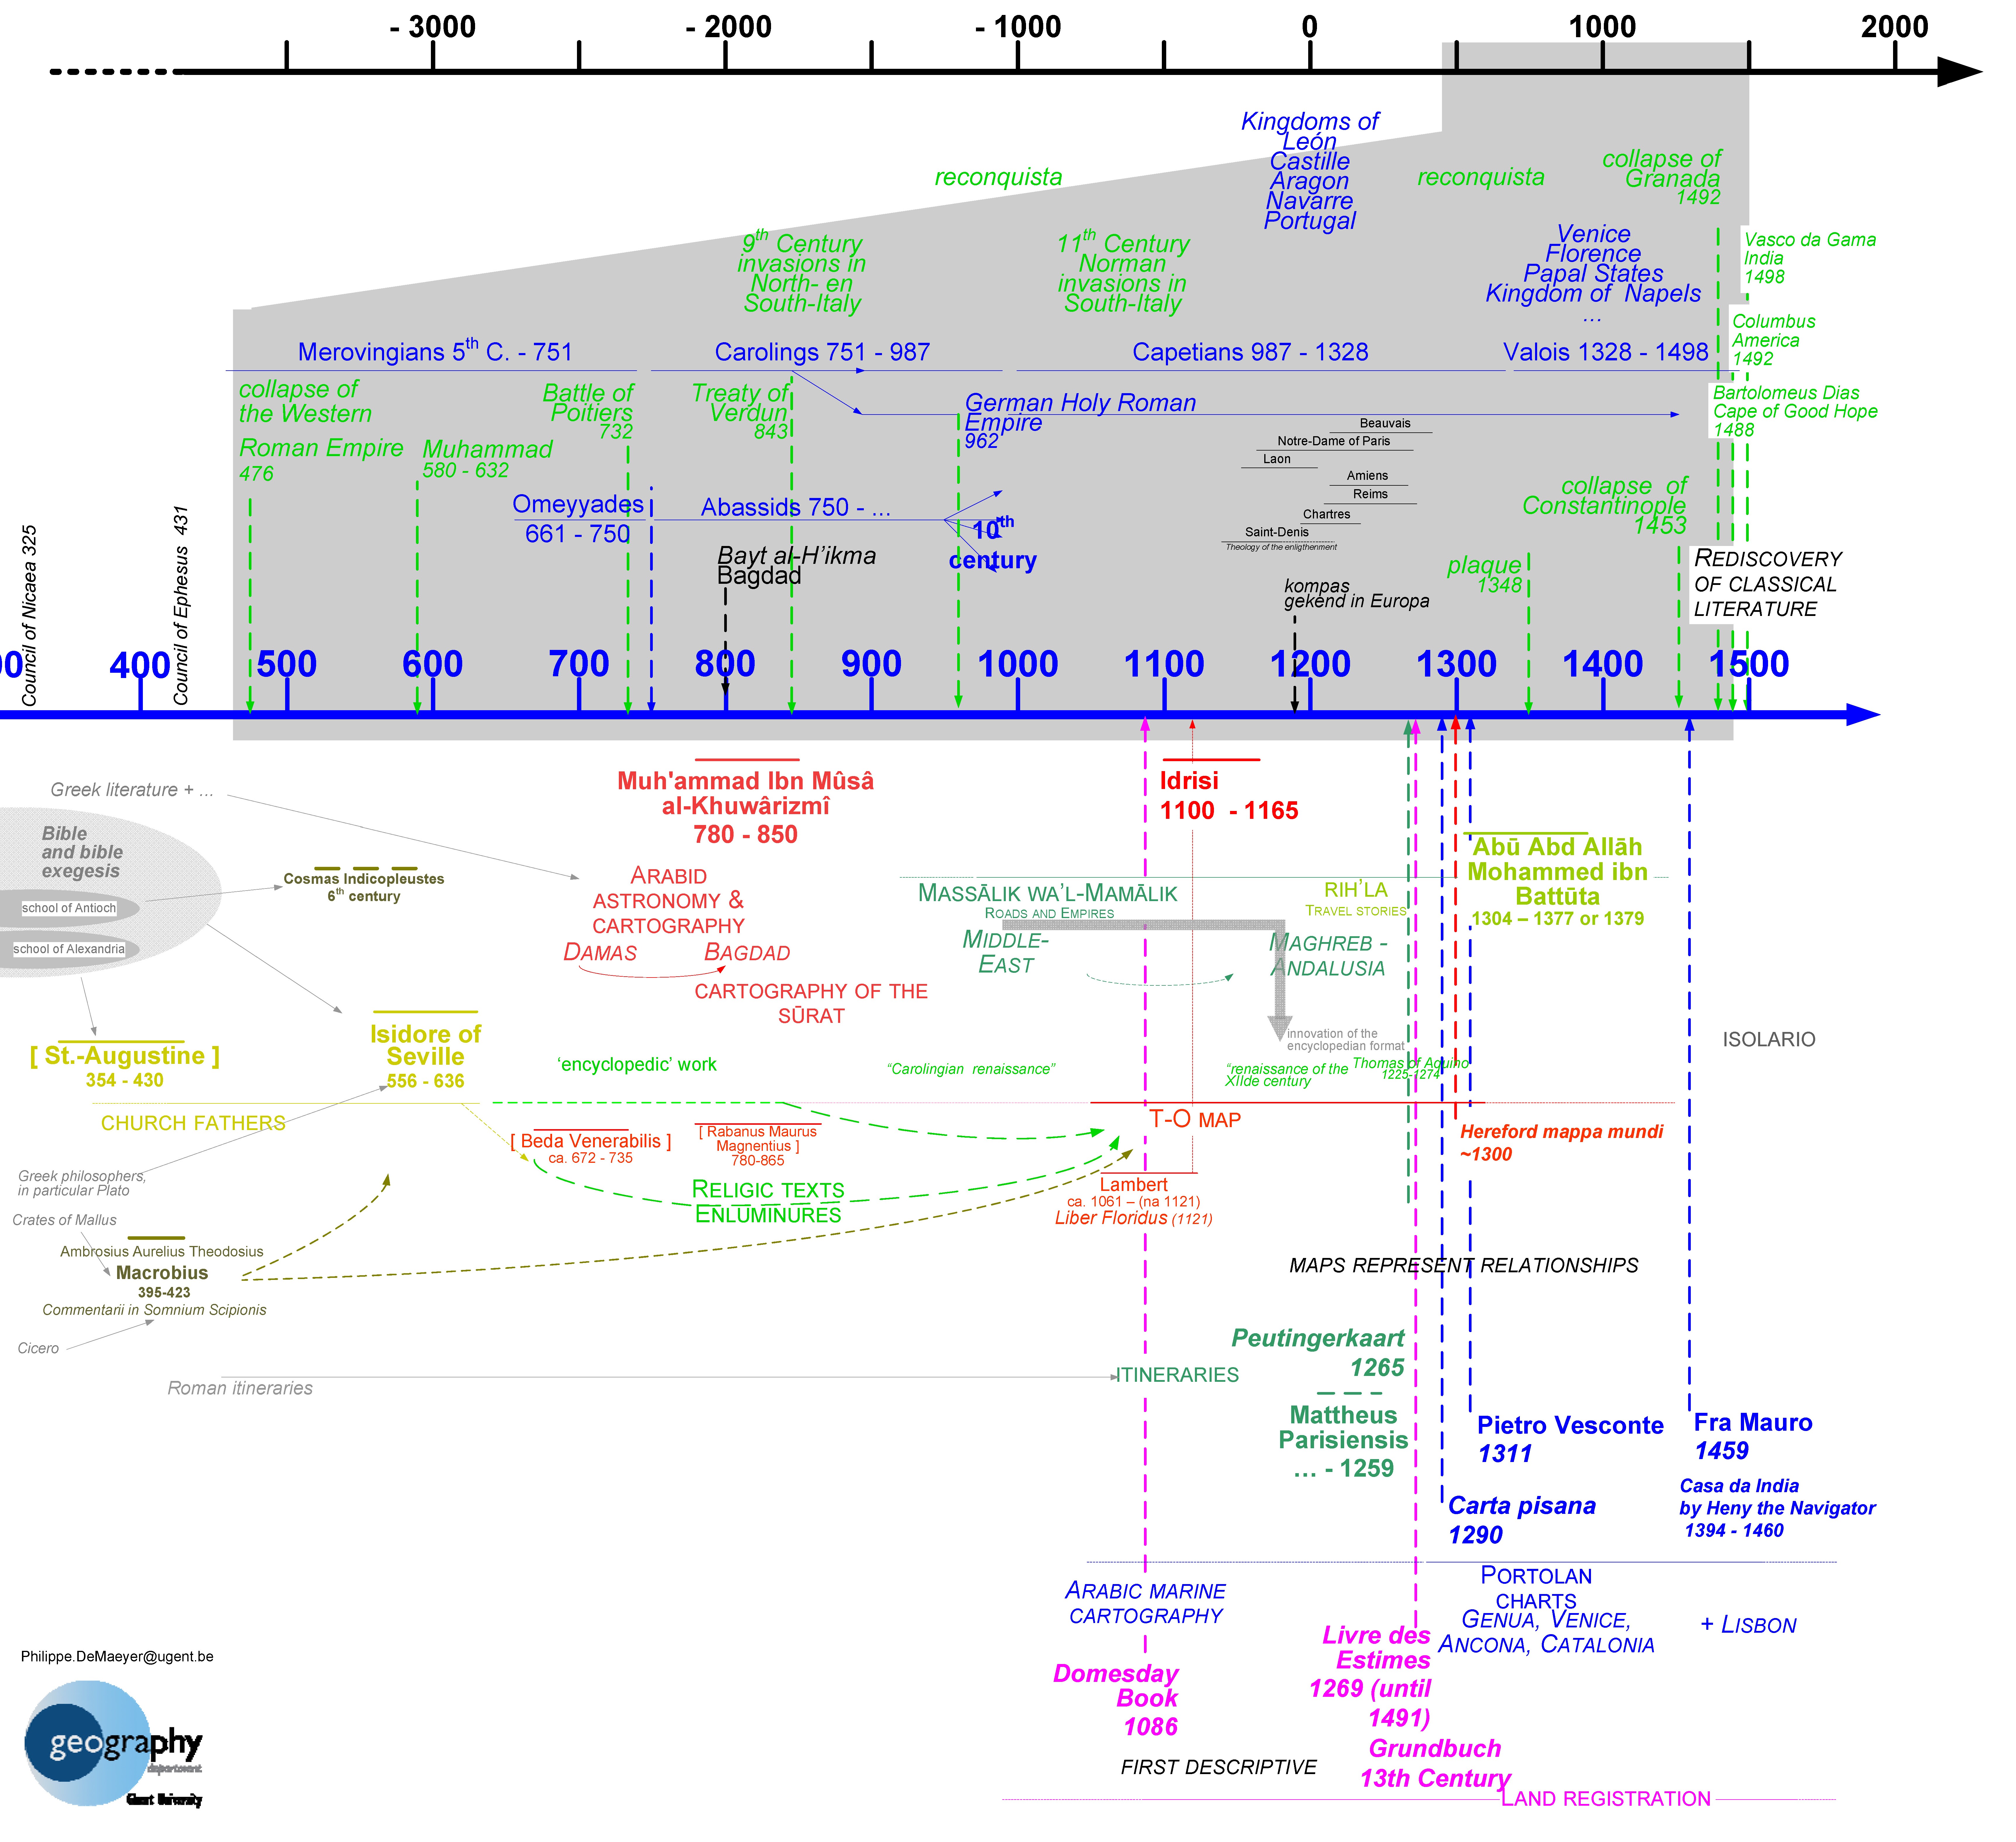
Comments on the 'Middle Ages' timeline
With the advent of Christianity, Bible commentators like Isidore, bishop of Seville, (who transferred Macrobius' influential view of the cosmos) were inspired by Genesis to picture the world as a giant disk, with Jerusalem at its centre. There were three continents, each one peopled by the descendents of a son of Noah, after the Flood. Asia by those of Sem, Europe by those of Japhet and Africa by those of Cham. Between these three continents, three big rivers flew: the Nile, the Mediterranean and the Tanais (Don). All around this inhabited world, there was one enormous ocean. The overall picture was this of a T in an O. But not only Christians saw the world as T-O shaped. Muslims pictured it likewise, with Mecca at the centre.
Al Idrissi, probably the most famous Arab cartographer, wrote his masterpiece, the Kitab, as a compilation of Arab and Greek sources, but also based upon his own observations. It contained a world map. By this time, different types of maps emerged alongside the global T-O maps: the Arab marine cartography, and later the portolans (sea charts), the itineraria (with the famous Peutinger map, copied on a Roman example, and the registration of the land (first descriptive, later in the form of Landboeken).
 (JPG file, 5.4 MB)
Comments on the 'Renaissance' timeline
Around 1500 the world exploded: classic Greek and Roman works were re-discovered, printing became widely spread in the West and it was the time of Discovery. The Portuguese, with their state-supported exploration, largely contributed to the development of cartography, as well as the Italians. Since the late 15th century, maps were more and more made by engraving copperplates, instead of using woodcutting (not to be confused with wood engraving). This allowed a clearer printing and a higher print run. In the 16th century, the Netherlands became very important in the field of cartography, the centre of gravity being in the South. At the University of Leuven, Gemma Frisius laid out the basics of triangulation, which Jacob Van Deventer applied in his mapping of regions and cities in the Netherlands. Mercator, another alumnus of Frisius, built globes, made maps and instruments and finally gained eternal fame with his projection. Many others were active in this terrain, often in Antwerp, around printer and editor Plantin: names like Ortelius, de Jode, Hondius are just a few, of which many fled the South after 1648, when the Netherlands were divided between the catholic, Spanish South and the dominantly protestant Republic in the North.
Thus Amsterdam became the new centre of gravity for cartography. This golden age would bring forth names like the families Blaeu, Visscher and Covens-Mortier, without forgetting the crucial, stimulating role this big, first multinational played: the VOC, the Verenigde Oost-Indische Compagnie. But another nation began to rise on the cartographical horizon. France, under the brilliant, authoritarian, imperialistic and money-devouring reign of Louis XIV, soon harboured an Académie des sciences and an Observatoire de Paris. And, again, it was a few families (Cassini, Sanson, de l’Isle, etc.) who transmitted their cartographical knowledge (and genes!) for a few generations, consecutively obtaining the title of géographe du Roi. From 1750 on, British cartography however was gaining momentum, certainly in the area of marine cartography, with legendary explorers like Cook. In the 18th century, it is also striking how the monarchs wished to see their possessions measured (remember, in the Ancien Régime the king owned the country, hence the interminable succession wars and the need for military maps!): first, there was the Carte de France, but at the end of the century the Austrian Habsburgs also had their Netherlands mapped by Ferraris.
 (JPG file, 2.06 MB)
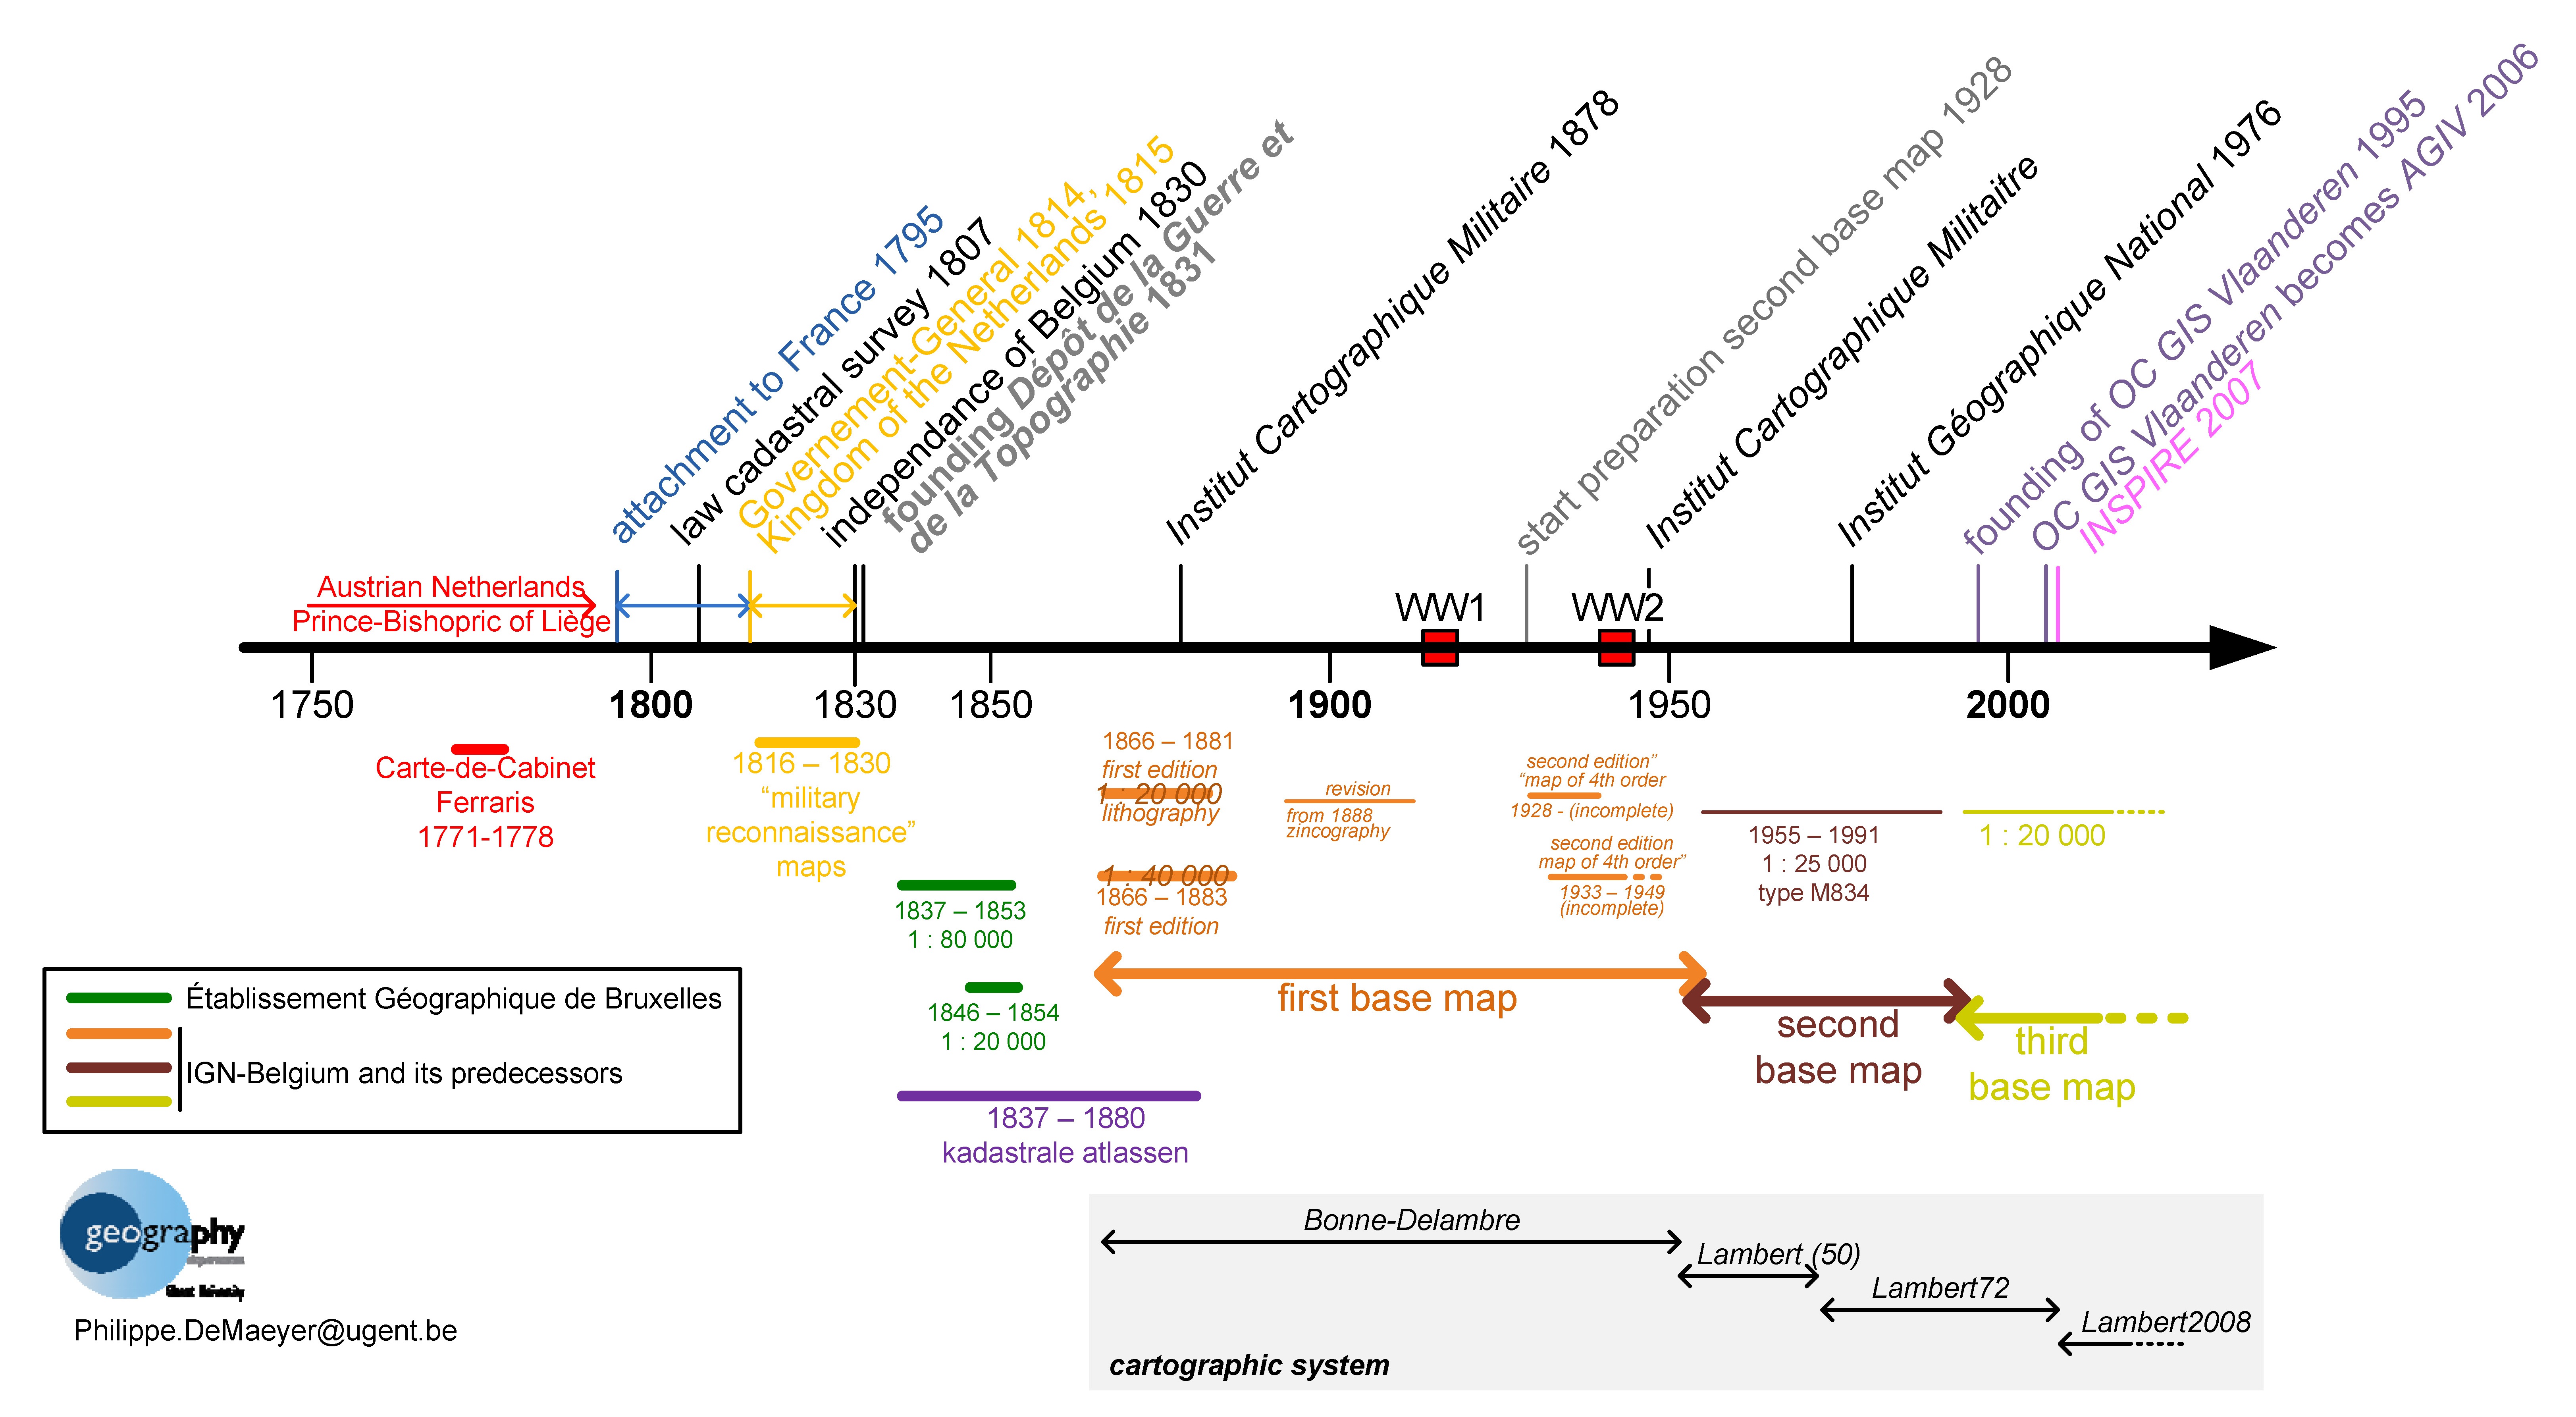
Comments on the 'Belgium' timeline
By the end of the 18th century, science was rapidly developing, also in the fields of geodesy and map projections, sustained by mathematical and technological progress. The printing techniques were also rapidly evolving. A new method, lithography, used stone as a surface for drawing and then printing. When the region that was the future Belgium became French in 1795, maps were made for both civil and military purposes. The civil maps were so-called cadastre (cadastral survey) maps, that were made with new, rational methods: the scale was metric (before, the landboeken used local measurements); each community had its system of coordinates: the meridian was drawn through the church and the latitude lines were drawn perpendicularly to that. These maps were made for tax reasons and would continue to be made in the new Belgian state, by people like Vandermaelen and Popp.
The military maps knew a different, more capricious history. The French military already had started mapping the areas that would later form the south border of Belgium, under Louis XIV. During the reunion of the Netherlands under Dutch reign (Koninkrijk der Nederlanden), the Dutch military started to map this new country, but due to the Belgian Independence in 1830, the Dutch left with the work unfinished, taking whatever had been achieved with them. The new Belgian state immediately created the Dépôt de la Guerre that in 1860 would finally issue the first base map on a 1:20 000 scale. By that time, the lithography allowed colour printing and from 1872 zincography would use zinc plates rather than stone.
It is only after the Second World War that a second base map on a scale of 1:25 000 was edited by the re-named Institut Géographique Militaire (IGM) / Militair Geografisch Instituut (MGI) (and not Institut Cartographique Militaire / Militair Cartografisch Instituut as mentioned by mistake on the figure). Changed again in 1976 into the Institut Géographique National (IGN) / Nationaal Geografisch Instituut (NGI), it started the production of the third base map of Belgium from 1991, this time again on a 1:20 000 scale. Finally, it would be inconceivable to talk about 19th century mapmaking in Belgium without mentioning the Établissement Géographique de Bruxelles, founded by the already mentioned Philippe Vandermaelen, who was the greatest and most productive Belgian 19th century cartographer and whose legacy is today kept in the Royal Library of Belgium.
Caroline De Candt